Understanding Stock Valuation 


PE Ratio for Valuation


Considering where the Philippine economy and Asia are situated right now, the market has been talking about companies with attractive valuation.

Valuation? What is this, and how can we determine whether or not a company is currently trading at good value?

This article is written to better educate you regarding stock valuation and the common methodologies we use here at BDO Securities.  We will be covering everything from PE ratio and dividend discount model, to discounted cash flow (DCF), EV/EBITDA, and sum-of-the-parts (SOTP) valuation.

This article discusses one of the most well-known stock market financial metrics around the globe, the price to earnings ratio (PE ratio). Whether you’re watching Bloomberg News Asia, CNBC in the United States, or the local,

Market Edge, you’ll likely hear the words “PE Ratio” peppered throughout the programs.
A PE ratio can be helpful when it comes to evaluating whether or not to purchase a stock.  You may want to consider the following assessment methodologies to evaluate a stock using PE ratio:

  1. Compare a company’s current PE ratio to its historical and/or projected PE ratios.
  2. Compare a company’s current PE ratio with its closest peers or competitors.
  3. Compare a company’s current PE ratio with its industry sector, or the index if the company is an index stock.

Keep reading to learn how to use PE ratios and these three (3) proposed applications.

*Note that the examples and methodologies below are more in line with that of a value investing approach to investing.


Stock PE Ratio Example


Before we discuss the three (3) methodologies mentioned above, let us go over an example of a PE ratio using Shakey’s Pizza Asian Ventures Inc. (stock symbol PIZZA).

The PE ratio is derived through the use of two simple numbers:

  1. Stock Price
  2. Earnings Per Share

To calculate a PE Ratio, all you need to do is divide the Stock Price by the Earnings Per Share of a specific stock.

Last Tuesday (April 21, 2020), the earnings per share (EPS) of PIZZA was P0.47*.

*For reference, a company’s EPS can be found in our coverage reports.


The PE ratio of PIZZA is as follows:

  • Share price of company’s stock / earnings per share of company’s stock = PE Ratio
  • P5.84/P0.47 = 12.4x
  • The P/E ratio of PIZZA is 12.4x


One way to think of this 12.4x is that investors are paying 12.4x times more than PIZZA’s current earnings for the stock. 

Here’s an easier example to help you grasp the PE ratio:

Imagine you want to buy a restaurant from a family friend.  How much do you decide to pay for the restaurant?  Well, one way is to look at the earnings of the restaurant. But it is not enough to know the current earnings. You will need to assess how much more earnings can the company generate in the future and how much more value-added service the company is going to generate for you. All the information and assumptions must be included in your valuation model. Therefore, notice that your PE ratio (or valuation of the company) is never only 1x or 2x; it’s normally higher. Like in the case of PIZZA, it’s 12.4x – what a premium! So, if a restaurant makes a P5,000,000 annual profit (earnings) and you decide to pay 12.4x that profit, it is equivalent to paying P62,000,000 for a restaurant that earns only P5,000,000 per year.

Sounds a lot right? So how do we make sure that we limit the risk of overpaying for a certain company?


The next topic will discuss the three (3) proposed methodologies which we believe will help us understand the relevance of the PE ratio and how it can help us decide if PIZZA is a buy or not.


1 - Compare a company’s current PE ratio to its historic PE ratio (and forecasted PE ratio if applicable).

The past average PE ratios of PIZZA are:

1 2019 Average PE Ratio = 20x
2 2018 Average PE Ratio = 23x


With these historic PE ratios in mind, we can now ask some questions about PIZZA as a business.

1 Will the business model of PIZZA remain intact after COVID-19?  
2 Will the company return to its previous profitability and grow earnings in the mid to long-term?


If you believe PIZZA will return to previous profitability at 20x to 23x, then buying it today at 12.4x is considered cheap and may be worth the buy.  

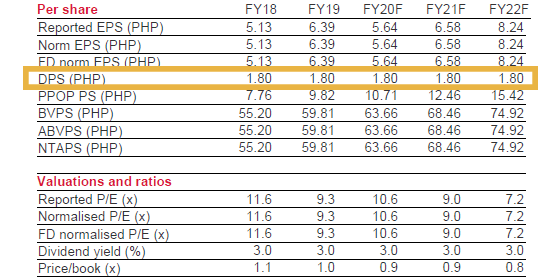
In some situations, you will find forecasted PE ratios in areas such as the BDO Securities coverage reports.  When available, these forecasted PE ratios may help you better evaluate a stock.   

So, is PIZZA a buy or not? 

When it comes to PE ratios, comparing current numbers to historical numbers (and forecasted numbers if applicable) may help distinguish if today’s PE ratio is low or high.

But it may not be enough to simply compare the stock with its historical PE because we are comparing PIZZA only with itself. What if there are other businesses out there with similar business models as PIZZA but are trading at a lower PE ratio than PIZZA. This factor can influence your decision to buy or forego PIZZA as well.


2 -Compare a company’s current PE ratio to its closest competitors

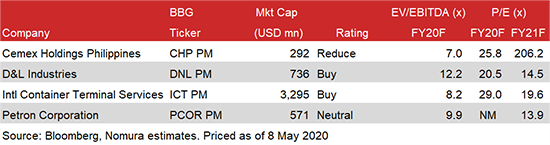
To compare PIZZA to potential peers, we may be able to view the PE ratios of Max’s Group Inc. (MAXS) and Jollibee (JFC).  According to Bloomberg:

1 MAXS has a PE ratio of 7.2x
2 JFC has a PE ratio of 23.5x. 

For this consideration, you would need to make a decision whether PIZZA is a better company to purchase than MAXS and JFC by simply using the current PE ratios.


3- Compare a company’s current PE ratio to the sector it belongs to, or the PSEi if it is an index stock.

In case we are unable to find a similar peer or competitor for comparison purposes, an alternative is to compare the company’s PE ratio with the PE ratio of the industry, or the PSEi if the company is an index stock.


Sectors

Looking at the PE ratio of the general sector that PIZZA is categorized under can help you understand whether the stock is cheap or expensive vis-à-vis the bigger industry. In this case, BDO Securities houses PIZZA under the consumer sector along with the companies below:

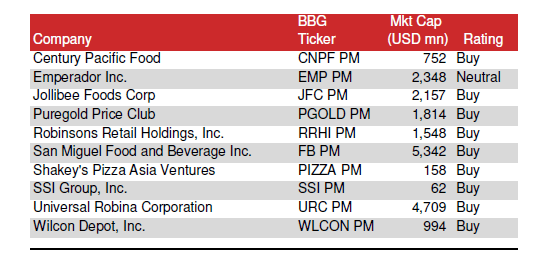
The PE ratio of the consumer sector (as of market close April 21, 2020) is 23.7x.  Since PIZZA only has a PE ratio of 12.4x we can see it’s much lower than the overall sector. As we discussed earlier, if you believe the business model of PIZZA will remain intact after the effects of COVID-19 and the company can return to previous levels, the low PE ratio of PIZZA compared to the overall sector may be a good sign for a bullish investor.


PSEi

Alternatively, we can compare the PE ratio of a stock to the PE ratio of the PSEi especially if the company is an index stock.

Below is the historical PE ratio of the market going back to April of 2005.

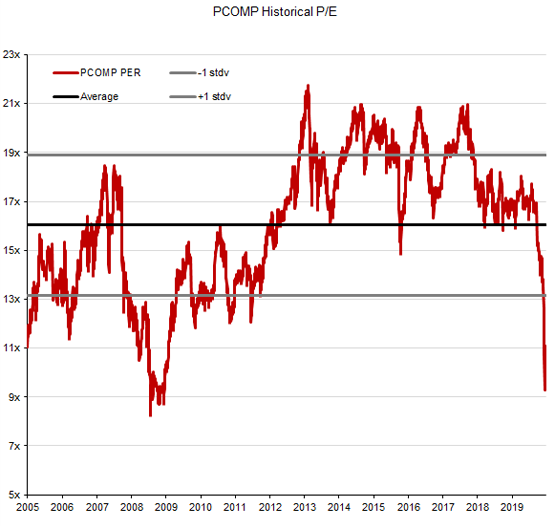
*The above chart shows the PSEi as of April 3, 2020


As you can see, the average PE ratio (thick black line) over the past fifteen years is approximately 16x. With the recent market decline, the PSEi currently trades at a PE ratio of approximately 11x (as of April 3, 2020) which is down from 17x at the end of 2019.

With the current PE ratio of  PIZZA being 12.4x versus that of the PSEi’s (comprising of the PSE’s largest and most liquid companies) PE ratio of 11x, how does PIZZA fare?


In summary, when using PE ratios you can compare:

  1. A company’s current PE with its historical average, or even projected PE ratio, if available.
  2. Against similar peers or competitors
  3. Against its sector, or even the PSEi, if an index stock.


The PE ratio is one of the most popular valuation methodologies, but it is not the only one.  Be sure to read our other valuation article to learn more.  Thanks for reading, and good luck investing this week!


Read our suggested articles below to help you invest with BDO Securities.


How to Find Dividend Paying Stocks with BDO Securities


Disclaimer: This is not a research report. The information, opinions and analysis contained herein are based on sources and data believed to be reliable but no representation, expressed or implied, is made as to its accuracy, completeness or correctness. This material is only for the general information of the authorized recipients. In no event shall BDO Securities or its officers and employees, including the author(s), be liable for any loss/damage resulting from reliance, directly or indirectly, or information found within this report.


Dividend Discount Model for Valuation


Welcome to our second article discussing stock valuation!  Last week we discussed the PE ratio and how it’s used to help decide if a stock is worth buying.  This week, we will be discussing the dividend discount model (DDM) and how it’s used to determine a target price for a stock. 

Whether you’re new to investing or you’ve been doing this for a while, chances are you’ve heard of dividends.  These are payments (usually paid in cash) to shareholders of a company.  The dividend discount model uses dividends to derive a target price for a stock. 

Remember, target prices are calculated by BDO Securities analysts for the stocks we cover.  We use the dividend discount model to value some stocks, such as Metrobank, BPI, and Security Bank.  You can always find these target prices in the WEEKLYWRAP and/or coverage reports.


How to calculate for DDM

The formula for DDM is as follows:


Target price of stock = forecasted dividend / (cost of equity – growth rate of dividend)


Given the above formula, we can now discuss each of the variables in the DDM. 

Forecasted dividend – If the company has a consistent history of dividend payments, you may be able to project next years’ dividend based on average dividend payout ratios and earnings growth. Such consistency can also be attributed to a company’s dividend policy (if in place). This is a formal program that the company normally adheres to (but still subject to the Board’s approval) and is the reason why a company pays out x% of previous year’s net income to shareholders as dividends. This percentage (%) is known as the Dividend Payout Ratio and differs from one company to another. 

Cost of equity – There is more than one way to calculate the cost of equity.  But one common method is to take a historical average market risk-free rate and add a market risk premium to this.
The market risk-free rate is normally associated with the long-term PH government bond. While the risk premium would be the estimated credit spread taking into account current market risks.

Growth rate of the dividend – one way to calculate the growth rate of the dividend is by multiplying the dividend payout ratio by the return on equity (ROE).


Hypothetical example of DDM

To better understand DDM, we can use the hypothetical company, AAA Corp. The information needed for DDM is as follows:


Forecasted dividend = P1.00

Cost of equity = 14%

Dividend payout ratio = 25%

ROE of the company = 13%.


Before we discuss the forecasted dividend, let’s talk about the dividend payout ratio. 

We will assume that at the end of the fiscal year, AAA Corp. has the following earnings (profits) and pays the following dividend:


Earnings = P1 Billion

Dividend = P250 million


As we can see, AAA Corp. has a profit of P1 billion but only pays a dividend of P250 million.  This is because corporations retain some earnings and reinvest them in the business.  We can calculate the dividend payout ratio of AAA Corp. as follows:


Dividend Payout Ratio = dividend / earnings

Dividend Payout Ratio = P250 million / P1 billion

Dividend Payout Ratio = 25%


We can now look at the historical dividend payout ratios as follows:


2017 – 25%

2018 – 25%

2019 – 25%


Since the dividend payout ratios have remained consistent, we don’t have to factor in a change in the payout ratio when calculating the forecasted dividend.

We can now look at the historical dividend paid by AAA Corp. as follows:


2017 – P0.76

2018 – P0.83

2019 – P0.91


We can see from the above dividend payments that the growth of the dividend is consistently around 9-10%.  Since the dividend payout ratio has remained constant and dividends have grown around 9-10% annually, we can assume the dividend will grow at a similar rate and we can forecast a dividend of P1.00.

Now, to calculate the growth rate of the dividend for AAA Corp. we can do the following:


Growth rate of dividend = (ROE * [1 – dividend payout ratio])

Growth rate of dividend = .13 * (1-.25)

Growth rate of dividend = .0975 = 9.75%


Now that we have the growth rate of the dividend, we can calculate the target price of AAA Corp. as follows:


Target price of stock = forecasted dividend / (cost of equity – growth rate of dividend)

Target price of stock = P1.00 / (0.14 – 0.0975)

Target price of stock = P23.53


We’ve used the DDM to calculate a P23.53 target price for our hypothetical stock, AAA Corp.  The next step you would take is to look at the current stock price of AAA Corp.  If the stock were trading for less than your P23.53 target price, it could be a potential buy for you.


DDM using BPI

To show a real-world example of the dividend discount model at work, we can use Bank of the Philippine Islands (BPI) as an example through our recent coverage report.

The analysts at BDO Securities use a slightly more complicated method to calculate the DDM for BPI than was shown in our example above.  First, they assume annual dividends to be fixed for 3 forecast years, consistent with the historical fixed dividend payouts.  They then project a terminal value based on an assumed average dividend payout ratio of 20%, cost of equity of 11%, sustainable normalizing ROE of 12%, and a growth rate of 9.6%. 

If you’re not familiar with terminal value:

It’s a financial method used to calculate the value of all future cash flows past the forecasted date.  In this example, it is used to calculate the value of all future dividends after the third year.

After the analysts’ calculations, a target price of P84.00 is computed for BPI.  Since the current stock is trading at P59.50, there is an upside potential of +41.2%.


BPI Coverage Report

Below you can see the location of some of the information in the BDO Securities coverage report of BPI.


Dividends per share


On page two of the BPI coverage report, you can see the dividends per share 2018 – 2022 (forecasted).  Every coverage report includes per share information and dividends per share can be found here


Valuation methodology


Under the appendix section of page 5, you can see the valuation methodology.  This can help shed light on the assumptions used by the BDO Securities analysts.  The above snippet shows the assumption of a 9.6% growth rate, as well as normalized ROE of 12% and an assumed dividend payout ratio of 20%.


Issues with DDM


There is one important issue with DDM we should mention.  As you may have realized, it’s impossible to use DDM to value a stock if the company does not consistently pay dividends.  Many start-up stocks in their growth phase do not pay dividends, as they reinvest most of their profits back into the company to expand operations.  As such, DDM is often used for more established or mature companies with a history of consistent earnings, cash flows, and dividend payments.  DDM isn’t an appropriate tool to value companies that lack the track record of consistent earnings and dividends. 


On that note, next week we will be discussing the discounted cash flow (DCF) method of valuation which can be used for growth stocks, as well as dividend-paying stocks.
We hope you’ve learned about the dividend discount model and how it’s used to calculate target prices for stocks.  Thanks for reading, and good luck investing this week!


Read our suggested article below to help you invest with BDO Securities:


How to Find Dividend Paying Stocks with BDO Securities


Disclaimer: This is not a research report. The information, opinions and analysis contained herein are based on sources and data believed to be reliable but no representation, expressed or implied, is made as to its accuracy, completeness or correctness. This material is only for the general information of the authorized recipients. In no event shall BDO Securities or its officers and employees, including the author(s), be liable for any loss/damage resulting from reliance, directly or indirectly, or information found within this report.


EV/EBITDA (Enterprise Multiple) Valuation


Welcome to the fourth article of our valuation series!  Thus far, we have discussed the PE Ratio, dividend discount model, and discounted cash flow methods of valuation.  Today’s valuation method is the EV/EBITDA, aka the Enterprise Multiple. 

The enterprise multiple takes two popular metrics and uses them to create a multiple that can be compared between companies within an industry.  It uses the EV (enterprise value) of a company and divides it by the EBITDA (earnings before interest taxes depreciation and amortization).

Some investors consider the enterprise multiple as a better way to compare companies in different countries, since countries have different tax rates, debt rates, etc.  It can also help to compare companies that are in more cyclical industries and have higher capital expenditures.

To understand the enterprise multiple, let’s dissect the two parts of the multiple starting with EV.


Enterprise Value (EV)


One way to think of EV is as a theoretical takeover value of a company.  If a company is to be purchased by another corporation, the EV of the company is a much more accurate way to calculate the takeover price than the market capitalization of the company.  This is because EV includes important pieces of the business, such as debt.  If a company is going to be purchased by another company, the purchasing company should consider the acquisition target’s debt as part of the acquisition cost; EV factors in the debt of that company.


The following are needed to calculate the EV of a company:


Market capitalization

Preferred shares

Minority interests

Total debt

Cash and cash equivalents


First, the market capitalization of a company is the total shares outstanding multiplied by the stock price of the company.  For example, if a hypothetical company named Schultz Inc. has 500 million shares outstanding and is trading at P1.00 per share, the total market capitalization of the company is:


Market capitalization = shares outstanding x price per share

Market capitalization = 500,000,000 x P1.00

Market capitalization = P500,000,000


As we can see, the market capitalization of Schultz Inc. is P500,000,000.  Let’s think about this number.  If a new company called Rich Corp. wants to purchase Schultz Inc., it will need to calculate the price of Schultz Inc. and also factor in the debt and cash/cash equivalents of Schultz Inc.

Assume Schultz Inc. has P200,000,000 of debt and P50,000,000 of cash and cash equivalents.  We can calculate the EV of Schultz Inc. as:


EV = Market capitalization + Total debt – Cash & cash equivalents

EV = P500,000,000 + P200,000,000 – P50,000,000

EV = P650,000,000


As we can now see, the EV of Schultz Inc. is P650,000,000.  This is significantly higher than the P500,000,000 market capitalization of the company; and thus, the price the company may sell for is P650,000,000 (not P500,000,000).

If Shultz Inc. would happen to have issued preferred shares, this would also have to be deducted from the total value. Likewise, minority interests should be deducted if present. These two additional facets account for the “equity” part of the company that common shareholders have no claim over.


Earnings before interest taxes depreciation & amortization (EBITDA)


When you hear about a company’s earnings, you’re usually hearing about the net income of the company.  The net income is the income the company earns after subtracting things like interest expenses, taxes, depreciation, and amortization.  When comparing companies within an industry and across countries, many consider the EBITDA comparison to be a more “apples-to-apples”, “like-for-like” type of assessment as compared to comparing net income.  It allows investors to compare profits of a company without factoring in things like accounting and financing treatments/practices.


There are a few ways to calculate EBITDA.  We will use the following for our computation:


Net income

Interest expenses

Taxes

Depreciation & amortization


First, we will use net income (aka earnings) because they are readily available and should be easy to find.  Net income is the result of subtracting interest, taxes, and depreciation/amortization, so we need to find all of these items and add them back to net income to find the EBITDA. 

Let’s assume Schultz Inc. has net income of P25,000,000, interest of P5,000,000, taxes of P8,000,000, depreciation & amortization of P10,000,000.

We can use the below formula to calculate EBITDA:


EBITDA = net income + taxes + interest expense + depreciation & amortization

EBITDA = P25,000,000 + P5,000,000 + P8,000,000 + P10,000,000

EBITDA = P48,000,000


Now we can see the EBITDA is P48,000,000.  Given that we now know both EBITDA and EV, we can calculate the enterprise multiple of Schultz Inc.


Enterprise Multiple (EV/EBITDA)


We now have everything we need to calculate the enterprise multiple (EV/EBITDA) of Schultz Inc.   The calculation is simple now that we have both the EV and EBITDA.  All we need to do is the following:


Enterprise Multiple = EV/EBITDA

Enterprise Multiple = P650,000,000 / P48,000,000

Enterprise Multiple = 13.5x


We have computed an enterprise multiple of 13.5x for Schultz Inc. Now it’s time to do a comparative analysis to help us figure out if Schultz Inc. is a buy.


Comparative analysis with EV/EBITDA


Now that we’ve calculated the enterprise multiple, we can use similar comparative methods that we used in our previous PE Ratio article.

We can pursue the following comparative methods:


Compare against historical EV/EBTIDA

Compare against competitors EV/EBITDAs

Compare against sector and index EV/EBITDA


Compare against historical EV/EBITDA


We can look at the past EV/EBITDA and see how it compares to the current multiple. 


Schultz Inc. EV/EBITDA 2016 = 15.8x

Schultz Inc. EV/EBITDA 2017 = 17.2x

Schultz Inc.  EV/EBITDA 2018 = 20.3x

Schultz Inc. EV/EBITDA 2019 = 19.3x


So far we can see that the average enterprise multiple over the past few years is higher than the current enterprise multiple of 13.5x.  This isn’t necessarily a good or bad sign; it just means the company is cheaper right now.

A higher historical EV/EBITDA means that the company is less expensive compared to its historical multiple and a lower historical EV/EBITDA would mean the stock is more expensive compared to its historical multiple.


Compare against competitors EV/EBITDAs


We can select five (5) hypothetical competitors of Schultz Inc. and compare their EV/EBITA’s:


Corona, Inc.:  EV/EBITDA = 20.2x

Lock D Corp.:  EV/EBITDA = 15.2x

ECQ, Inc.:  EV/EBITDA = 21.2x

New Norm Corp.:  EV/EBITDA = 10.3x

Sanitization, Inc.:  EV/EBITDA = 14.4x


Since EV/EBITDA is a comparative metric, we can compare the above companies to see if Schultz Inc. has a high or a low EV/EBITDA.  Since the EV/EBITDA is 13.5x, we can consider the EV/EBITDA to be on the lower end.  This means that Schultz Inc.  may be undervalued compared to its competitors.


Compare against sector and index EV/EBITDA

We can also view the overall EV/EBITDA of the sector and/or the overall stock market index that Schultz Inc. belongs to.  Let’s assume Schultz Inc. trades in the retail sector, and is listed in the Philippine Stock Exchange Index (PSEi):


Retail Sector: Average EV/EBITDA = 18.9x

PSEi: Average EV/EBITDA = 16.2x


Above we can see that the average EV/EBITDA of both the PSEi and the Retail Sector are higher than Schultz Inc. This further strengthens the idea that Schultz Inc. may be undervalued. 

Since nearly all of the comparisons above point to an undervalued EV/EBITDA, Schultz Inc. may potentially be a Buy.  Of course, you would need to make sure there are no fundamental problems with the company that are reflecting the lower EV/EBITDA.  As long as there are no major problems with the company, it could be a potential Buy.


EV/EBITDA using PCOR


Not many companies are valued by BDO Securities using EV/EBITDA.  One of the companies we do value using this method is Petron Corp (PCOR).  PCOR is in the oil and gas industry which is classified within the industrials sector. Because companies classified as industrials typically operate in highly cyclical industries with large capex requirements, EV/EBITDA is an acceptable method to use.  So EV/EBITDA is a good valuation method to use when comparing PCOR to other companies within the industrials sector.

Below you can see a chart comparing EV/EBITDA of PCOR with other companies within the industrials sector.


As you can see, all companies above are operating in cyclical industries with high capex requirements. This is one of the reasons EV/EBITDA is a good tool for valuing PCOR; it works as an apples-to-apples comparison of companies which usually have significant depreciation and interest expenses, as well as varying capital structures.

The above shows 2020 EV/EBITDA of 9.9x.  The average 2020 EV/EBITDA for all companies is 9.3x, so PCOR has a higher EV/EBITDA and is relatively more expensive than peers.  
We hope this has helped you learn more about EV/EBITDA.  Thanks for reading, and good luck investing this week.


Another article to help you invest and find stocks with BDO Securities

Dividend Investing with BDO Securities


Disclaimer: This is not a research report. The information, opinions and analysis contained herein are based on sources and data believed to be reliable but no representation, expressed or implied, is made as to its accuracy, completeness or correctness. This material is only for the general information of the authorized recipients. In no event shall BDO Securities
 or its officers and employees, including the author(s), be liable for any loss/damage resulting from reliance, directly or indirectly, or information found within this report.


Discounted cash flow (DCF) valuation


Welcome to the third email of our valuation series!  Over the past two weeks, we have discussed both the PE ratio and the dividend discount model for valuation. 

This week, we will be discussing the discounted cash flow (DCF) method of valuing a stock.

The DCF method of valuation is like the dividend discount model in that it calculates a target price for a stock.  However, unlike the dividend discount model which uses projected dividends by a company to calculate the target price, the DCF method uses company projected/future cashflows to calculate the target price.


Time value of money


To understand DCF, it’s important to first understand the time value of money.

Let’s use an example to start:


If you were offered the choice between accepting P100 today or P100 two years from now, what would you choose?  More than likely, you would choose to take the money today.  Let’s say your goal is not to spend the money, but to save it.  Why then would you still want the money today and not two years from now?

Think about inflation.  If prices for goods increase by 5% each year, your P100 will be worth less money in the future.  By accepting the same P100 one year from now it will only be worth the equivalent of P95 (P100 less 5% inflation) in today’s pesos.  Two years from today the P100 is only worth P90.25 (P95 less 5% inflation). 

The time value of money is important to understand in terms of the DCF valuation.


Discounting cashflows


One way to think of DCF valuation is that it attempts to calculate the present value of a company using the future cashflows of the company.  Let’s use an example to understand the present value of future cashflows.

Imagine a company has cashflows of P1,000,000 this year.  If the company does NOT grow cashflows next year, how much will the cashflows be next year?  Of course, they will still be P1,000,000. 

The next question is, how much are next year’s cashflows worth today?  Or, what is the present value of next year’s cashflows. 

Like in our P100 example, if we assume 5% inflation, next year’s P1,000,000 cashflow will be worth P950,000.

So the present value of next year’s cashflow is P950,000.


In finance, the price of a stock is considered to be the present value of all future cashflows. 


To understand how a stock price is considered the present value of all future cashflows, we can assume the same company above has P1,000,000 in cashflows over the next 5 years.  Below is the value of those future cashflows.


Year 1 Cashflow: P1,000,000

Year 2 Cashflow: P1,000,000

Year 3 Cashflow: P1,000,000

Year 4 Cashflow: P1,000,000

Year 5 Cashflow: P1,000,000

Total cashflows: P5,000,000


The problem with the cashflows above is that they are not DISCOUNTED into today’s pesos.  Let’s calculate the present value of these future cashflows if inflation is 5%.


Year 1 Cashflow: P1,000,000 x (1-5%) = P950,000 

Year 2 Cashflow: P1,000,000 x (1-5%)^2) = P902,500

Year 3 Cashflow: P1,000,000 x (1-5%)^3) = P857,375

Year 4 Cashflow: P1,000,000 x (1-5%)^4) = P814,506

Year 5 Cashflow: P1,000,000 x (1-5%)^5) = P773,780

Total cashflows:  P4,298,161


As you can see, the total cashflows over the next 5 years are not worth P5,000,000.  Rather, they are worth P4,298,161.


Discount rate


We used a 5% inflation rate as a simplistic way to discount future cashflows.  However, when valuing a company, the calculation of the discount rate is a little more complicated. 

Many analysts use something called the weighted average cost of capital (WACC) as their discount rate.  Since WACC may seem a bit complicated, we won’t be going over the formula here.  But you can think of WACC as the average rate of return expected by stock and bond holders.  Since equity investors and debtors of a company may expect different rates of returns, WACC attempts to derive an average cost of capital between both equity investors and debtors.

Now that we know about WACC, we can replace our above example assuming WACC is 9% (instead of 5%).


Year 1 Cashflow = P1,000,000 x (1-WACC)

Year 1 Cashflow = P1,000,000 x (1-9%)

Year 1 Cashflow = P910,000


We can now use WACC for the cashflows which equal the following:


Year 1 Cashflow: P1,000,000 x (1-9%) = P910,000 

Year 2 Cashflow: P1,000,000 x (1-9%)^2 = P828,100

Year 3 Cashflow: P1,000,000 x (1-9%)^3 = P753,571

Year 4 Cashflow: P1,000,000 x (1-9%)^4 = P685,749

Year 5 Cashflow: P1,000,000 x (1-9%)^5 = P624,032

Total cashflows:  P3,801,452


Growth


In many situations, a company will experience growth in cashflows.  If cashflows have grown in the past and are expected to continue growing into the future, you will need to factor in that growth.  Using our above example, if we looked back at the past 5 years of cashflows and saw an average growth of 5%, we may assume that rate going forward:


Year 1 Cashflow: (P1,000,000* (1+growth rate)) / (1-9%)


Above we add the growth in the cashflow then discount that using WACC. 


We can determine the following cashflows:


Year 1 Cashflow: (P1,000,000 x (1 + 5%)) / (1-9%) = P963,303

Year 2 Cashflow: (P955,500 x (1+5%)^2) / (1+9%)^2 = P927,952

Year 3 Cashflow: (P912,980 x (1+5%)^3) / (1+9%)^3 = P893,899

Year 4 Cashflow: (P872,352 x (1+5%)^4) / (1+9%)^4 = P861,095

Year 5 Cashflow: (P833,532 x (1+5%)^5) / (1+9%)^5 = P829,495

Total cashflows:  P4,475,745


After forecasting a 5% growth rate in our cashflows, we have calculated a total of P4,475,745 worth of discounted cashflows over the next 5 years.


Terminal value


Let’s go back to our idea that the price of a stock is considered to be the present value of all future cashflows.  So far, in our above examples, we are only using 5 years of cashflows.  In reality, since the stock price is the present value of ALL future cashflows, we need to calculate ALL future cashflows going forward. 

We can do this using a terminal value.  If you recall from last weeks’ dividend discount model, we used a terminal value and defined it as:

A financial method used to calculate the value of all future cash flows past the forecasted date. 

In our example, we will use the terminal value to calculate the value of all cashflows after the fifth year.  We can use the following formula to calculate the terminal value.


Terminal value: 

Final year projected cash flow * (1+ perpetual growth rate) / (Discount rate – perpetual growth rate)


We can use the following assumptions for terminal value:


Final year projected cashflow = P829,495 (from our previous example).

Perpetual growth rate = 4%

Discount rate = 9% (WACC)

Perpetual growth rate = 4%


We can calculate terminal value as the following:


Terminal value:  P829,495 * ((1+ 4%) / (9% - 4%))

Terminal value:  P829,495 * 20.8

Terminal value:  17,253,505

Since we have the terminal value, we can simply add our 5 years of discounted cashflows to the terminal value:

DCF = 5 years discounted cashflows + terminal value

DCF = P4,475,745+ P17,253,505

DCF = P21,729,250


Interpreting the DCF


Again, let’s go back to those wise words, the price of a stock is considered to be the present value of all future cashflows. 

As we have calculated, the present value of all future cashflows turns out to be P17,362,370.  Let’s assume the stock has 15 million shares outstanding. This means that according to our DCF, the stock should be worth:


Target price of stock = value of company / shares outstanding

Target price of stock = P21,729,250 / 15,000,000

Target price of stock = P1.45 per share


Now that we know the stock should be trading at around P1.45 per share, we can look at the current trading price.  If the price is only P1.30, there’s an upside of 11.5%.  It’s then your decision whether this is a large enough upside for you.  If it is, you may want to purchase the stock.


DCF and RRHI


Let’s take a look at a recent coverage report using DCF valuation.  The Robinsons Retail Holdings (RRHI) coverage report was recently published by BDO Securities and we can see the target price below on the very first page of the report.


The PHP 85.00 target price forecasted by the BDO Securities analysts was derived through the use of a DCF valuation.  Some additional information regarding the inputs used by the analysts can be found under the Valuations and risks section of the report.


As you can see, the WACC used was 11.2% and the terminal growth rate used was 3.5%.

After the DCF analysis, the BDO Securities analysts calculate the target price of RRHI as P85.00.  Given the current price of RRHI is P65.00 there is an upside potential of just over 30% for RRHI.


We hope this helps you better understand how discounted cash flow is used to value stocks.  Next week, we will be discussing another valuation methodology, EV/EBITDA. 

Thanks for reading, and good luck investing this week!


Other article to help you invest and find stocks with BDO Securities

Dividend Investing with BDO Securities


Disclaimer: This is not a research report. The information, opinions and analysis contained herein are based on sources and data believed to be reliable but no representation, expressed or implied, is made as to its accuracy, completeness or correctness. This material is only for the general information of the authorized recipients. In no event shall BDO Securities or its officers and employees, including the author(s), be liable for any loss/damage resulting from reliance, directly or indirectly, or information found within this report.


Sum-of-the-parts (SOTP) valuation


Today’s valuation method is the sum-of-the-parts (SOTP) method of valuing a company.  The SOTP method is unique in that it can combine any of the valuation methods we’ve discussed in this valuation series.

As you likely know by now, BDO Securities uses different valuation methods depending on the company being analyzed.  One company may be valued using the DCF method, another may be valued using EV/EBITDA, and so on.  The valuation method used by the BDO Securities analysts for a particular company can range depending on the company’s business model, the structure of the company, industry of the company, etc. 

If different valuation methods are used for different companies, what method should be used to value a company with different companies housed under one large conglomerate?  For example, if a conglomerate houses a bank and a food processing business, what method should be used to value that conglomerate?  The answer is to use the SOTP method of valuation.


Sum-of-the-parts (SOTP) valuation


The SOTP valuation method involves valuing the different segments of a business and combining those to create a target price of the company stock.  The formula for SOTP is as follows:


SOTP

= value of 1st business segment

+ value of 2nd business segment

+ … value of nth business segment

= gross asset value

- parent debt + parent cash (or parent net debt)

= net asset value (NAV)

x (1 – conglomerate discount %)

= target price


Let’s use a hypothetical example similar to the above and calculate the SOTP for a conglomerate that owns a banking business and a food processing business.


Richie Rich Corp.


Richie Rich Corp. is a conglomerate that owns Yap Bank and Tsai Foods. 

In order to calculate the SOTP for Richie Rich Corp., we will first need to value both Yap Bank and Tsai Foods.  Let’s start with Yap Bank.


Yap Bank


To value Yap Bank we will use the dividend discount model (DDM).  As you may recall from our DDM article, we calculate the value of Yap Bank given a cost of equity of 14% and dividend growth rate of 9.75%:


Target price of stock = forecasted dividend / (cost of equity – growth rate of dividend)

Target price of stock = P1.00 / (0.14 – 0.0975)

Target price of stock = P23.53


*See the dividend discount model article for more details on how to get these numbers.


Once we have the value of the stock price for Yap Bank, we can multiply it by the shares outstanding to get the value of the bank in Pesos.  We will assume Yap Bank has 1 billion shares outstanding:


Value of Yap Bank = shares outstanding x target price of stock

Value of Yap Bank = 1,000,000,000 x P23.53

Value of Yap Bank = P23,530,000,000


Now that we have the value of Yap Bank, we can calculate the value of Tsai Foods.


Tsai Foods


To value Tsai Foods, we will use the discounted cash flow (DCF) method. To calculate the DCF we will assume a weighted average cost of capital (WACC) of 9% and cash flow growth of 5%. We will first use 5 years of cashflows and then a terminal value to calculate the DCF of Tsai Foods. 


5 years of discounted cashflows

Year 1 Cashflow: (P100,000,000 x (1+5%)) / (1+9%) = P96,330,275

Year 2 Cashflow: (P100,000,000 x (1+5%)^2) / (1+9%)^2 = P92,795,219

Year 3 Cashflow: (P100,000,000 x (1+5%)^3) / (1+9%)^3 = P89,389,890

Year 4 Cashflow: (P100,000,000 x (1+5%)^4) / (1+9%)^4 = P86,109,527

Year 5 Cashflow: (P100,000,000 x (1+5%)^5) / (1+9%)^5 = P82,949,545

Total Cashflows = P447,574,456


Now that we know Tsai Foods will generate P447,574,456 in discounted cashflows over the next five years, we can calculate the terminal value assuming a perpetual growth rate of 4% and WACC of 9%:


Terminal value = final year projected cash flow * (1+ perpetual growth rate) / (WACC – perpetual growth rate)

Terminal value = P82,949,545 * ((1+ 4%) / (9% - 4%))

Terminal value =  P82,949,545 * 20.8

Terminal value = P1,725,350,536


Now that we have the terminal value we can calculate the value of Tsai Foods using the DCF.


DCF = 5 years discounted cashflows + terminal value

DCF = P447,574,456 + P1,725,350,536

DCF = P2,172,924,992


If there was net debt for Tsai Foods, we would now subtract it.  However, for simplicity, we will assume the company has no net debt.


Now that we’ve calculated the value of both Yap Bank and Tsai Corp, we can calculate the net asset value of Richie Rich Corp.


*See the DCF article for more details on how to get these numbers.


Richie Rich Corp Target Price


Before we calculate the target price of Richie Rich Corp, we can look up parent debt and cash from the parent (or holding company) balance sheet. Below are the numbers for Richie Rich Corp.


Assumed parent debt = P250,000,000

Assumed parent cash = P50,000,000


We now have everything we need to calculate the net asset value (NAV) of Richie Rich Corp. using the SOTP:


SOTP

= value of 1st business segment

+ value of 2nd business segment

+ … value of nth business segment

= gross asset value

- parent debt + parent cash (or parent net debt)

= net asset value (NAV)


Below we can compute given our values.


SOTP

= P23,530,000,000

+ P2,172,924,992

= P25,702,924,992

- P250,000,000 + P50,000,000

= P25,502,924,992


According to the SOTP method of valuation, Richie Rich Corp. has a net asset value (NAV) or intrinsic value worth P25,502,924,992.  To calculate the NAV per share all we need to do is divide the total value of the company by the shares outstanding (assuming 1 billion shares outstanding).


NAV per share = value of the company / shares outstanding

NAV per share = P25,502,924,992/ 1,000,000,000

NAV per share = P25.50


According to the SOTP method of valuation, Richie Rich Corp. is worth P25.50/share.  You can now look at Richie Rich Corp. and see if it’s trading at more or less than P25.50.  If it is trading below/above the NAV, the stock may be undervalued/overvalued and is said to be trading at a discount/premium to NAV.  If the Richie Rich stock is selling for P12, the stock is said to be trading at a 53% discount to NAV and may be undervalued (buying opportunity).


Note that conglomerates own multiple businesses in various industries. It’s common to see share prices of conglomerates trade below their NAVs. This phenomenon is known as the conglomerate discount. This represents the valuation discount applied by the stock market to the share price of a conglomerate due to perceived inefficiencies from having multiple unrelated businesses. The value of the conglomerate discount varies depending on investors’ perception of the company.


BDO Securities analysts typically apply a conglomerate discount to their NAV estimate to factor this in and arrive at their target price.


Target price = NAV per share x (1 - conglomerate discount)


Going back to our example for Richie Rich Corp., assuming a conglomerate discount of 40%,


Target price = NAV x (1 – conglomerate discount %)

Target Price = P25.50x (1 – 40%)

Target Price = P15.30


We now know the SOTP target price for Richie Rich, Corp. is P15.30.  If the stock is selling for P12, there is an upside potential of 28%. Depending on your financial goals and risk appetite, this could be a healthy upside potential.


SOTP using Metro Pacific Investments (MPI)


Let’s look at a real-world example of how the BDO Securities analysts use a SOTP method for Metro Pacific Investments (MPI).


MPI includes different companies, ranging from power distribution and utilities, to hospitals and toll roads.  Because there are multiple different companies, BDO Securities analysts prefer a SOTP method for valuation. 


Below you can see the MPI valuation methodology from the May 07, 2020 coverage report.


The target price for MPI is based on SOTP which combines the values of Meralco (SOTP), its hospital business (EV/EBITDA), and tollroads and water businesses (DCF).  A conglomerate discount is also factored in after valuing the different companies. 


The BDO Securities analysts used the SOTP to derive the below May 07, 2020 rating and target price.


Many large conglomerates valued by BDO Securities analysts utilize an SOTP method of valuation because they include different companies that are oftentimes in different industries.


This marks the end of our valuation series!  We really hope this series has helped you learn more about the different ways analysts value stocks.  We’re also hopeful these articles will better help you understand BDO Securities reports going forward.  Thanks for reading this series and good luck trading with your newfound knowledge of valuation!


Another article to help you invest and find stocks with BDO Securities:


Dividend Investing with BDO Securities


Disclaimer: This is not a research report. The information, opinions and analysis contained herein are based on sources and data believed to be reliable but no representation, expressed or implied, is made as to its accuracy, completeness or correctness. This material is only for the general information of the authorized recipients. In no event shall BDO Securities or its officers and employees, including the author(s), be liable for any loss/damage resulting from reliance, directly or indirectly, or information found within this report.

For concerns, you may contact the BDO Securities Hotline at (+632) 8840-7878, Monday to Friday from 8:30 am to 5:00 pm, or email us via bdosec-customercare@bdo.com.ph. BDO Securities is a PSE and PDEx Trading Participant, an SCCP and SIPF Member, and is regulated by the CMIC with website  www.cmic.com.ph, and the SEC with telephone no. (+63916) 383-8633 and (+632) 8818-0921 and email address at msrd_srd@sec.gov.ph.

Financial product/s of BDO Securities are not covered by the Philippine Deposit Insurance Corporation and are not guaranteed by the BDO Unibank, as the case may be.

The BDO Securities, BDO Unibank and other BDO-related trademarks are owned by BDO Unibank. All Rights Reserved.