One of the three basic premises of technical analysis is that prices move in trends. One reason prices likely move in trends is due to the tendency of people to follow others (also known as herding). Herding happens regularly but it is particularly common during times of uncertainty and volatility. As a result, this behavioral pattern is reflected frequently in identified price patterns and can therefore be anticipated or projected.
Since the price patterns reflected in the market can be projected, technical analysis uses these patterns to trade. An example of this may be as market sentiment shifts from optimism to fear, a certain pattern might emerge before traders and investors start selling and send the stock price lower.
There are three trend directions and three trend classifications.
Trend Directions
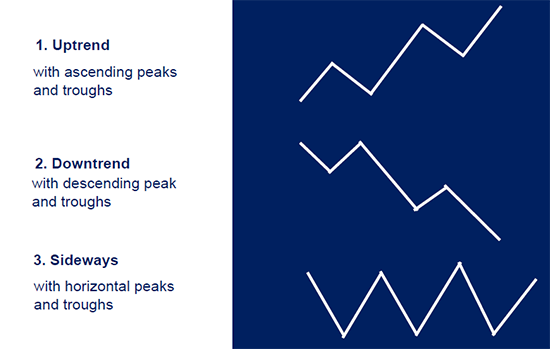
Above you can see the three different trend directions. The uptrend is an ascending trend, the downtrend is a descending trend, and sideways trends are horizontal without ascending or descending in any one direction.
Three Classification
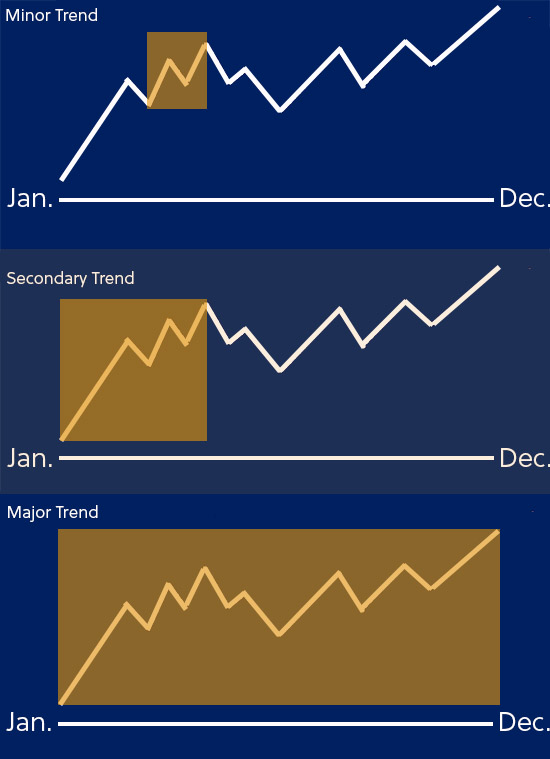
There are three classifications of trends that can move in any of the three trend directions mentioned above.
1. Minor trend – Short-term trend that lasts around 3 weeks or less.
2. Secondary trend – Mid-term trend that may last anywhere from several weeks to several months.
3. Major trend – Long-term trend that may last more than 1 year.
To summarize thus far, there are three trend directions (uptrend, downtrend, sideways) as well as three trend categories (major, secondary, minor). Now that we understand these directions and categories, we can use additional concepts to help use determine price targets and strategies given potential trends.
Support & Resistance
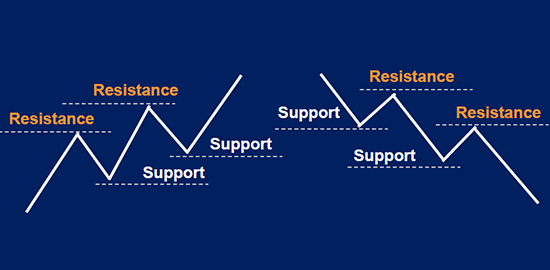
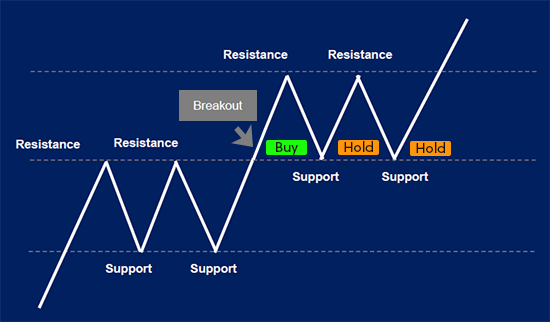
Support and resistance lines help traders establish areas of buying and selling pressure. For example, on the left side you can see an uptrend with resistance at the peaks and support at the troughs. One way traders utilize these support and resistance lines is by buying at breakouts above resistance and selling at breakdowns below support.
The below graphic shows how a trader may approach a stock. Some traders try to “anticipate price moves, and may buy when a stock is close to resistance levels and sell when it’s close to support levels. However, an approach with a better probability of success is buying at breakouts and selling at breakdowns. Below shows how a trader would purchase this stock after breaking through resistance.
Because buying around resistance and sellling around support is “anticipaing” the price movement of a stock, it is has a lower probability of being successful. By buying after a breakout, there is a higher probability of success. As you can see the trader holds around support instead of anticipating the stock breaking support. Only if the stock has a breakdown below support will they sell at their stoploss.
Another observation to note is that the original resistance level (left half of graphic) becomes a support level once the stock breaks out (right half of graphic). This is because the prices at the new support level may have buying interest since the stock was able to breakout of the previous resistance levels.
Trend Line & Channel
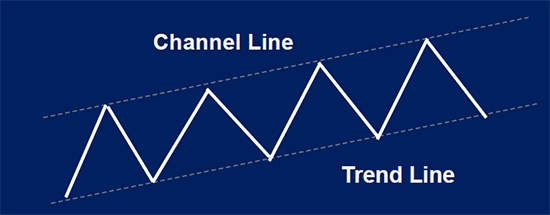
Traders also utilize the trend line and channel line. Above you can see that the trend line and channel line are drawn across the peaks and troughs of the uptrending price. A trend line is first drawn then the channel line is a parallel line drawn in the same direction of the trend line. If the above graphic were in a downtrend, the trend line would be on top with the channel line on the bottom.
The above graphic shows where a trader should buy and sell given a stock moving in an uptrend channel. The green area shows where a trader would buy after a breakout of the channel. The throwover in red is a market condition where prices briefly or temporarily break beyond the existing trend line as a result of a sudden surge in either market demand or sell down. This situation usually normalizes as the market eventually realizes that it may have overreacted to a certain catalyst. A throwover can fool traders so be mindful of a true breakout before buying.
Retracement
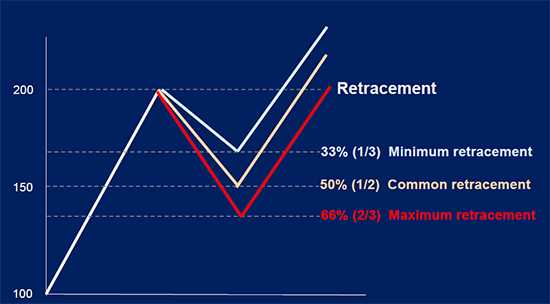
Fibonacci Retracement is another way to decide which levels to trade a stock. This is a tool used by many traders and it includes three common retracement levels. A trader may be mindful of each of the three levels and make decisions with Fibonacci Retracement in mind.
Above you can see the three common retracement levels are 33%, 50%, and 66%. In the above example, a trader would use the three levels. For example, if the stock bounces off the 33% minimum retracement, a trader may see this as an entry point to purchase the stock. If it falls past the 33% retracement to the 50% then bounces, a trader may purchase at that level, and so on…
What would you do?
Let’s test your knowledge with the below example.
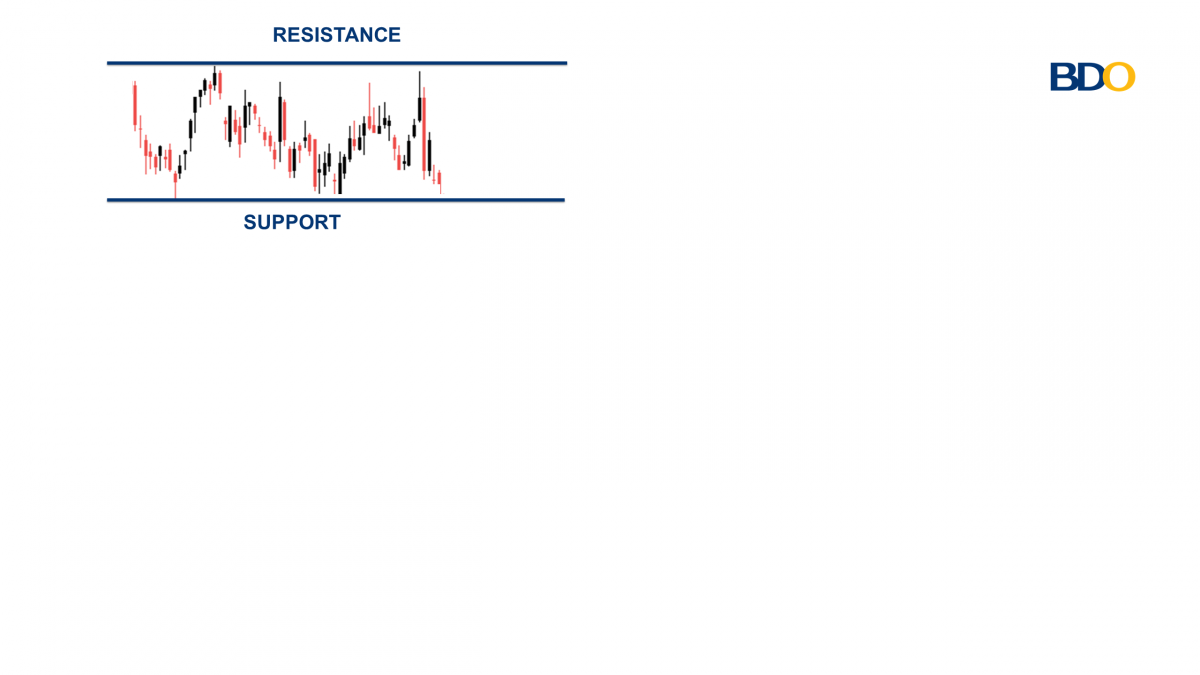
Given this chart, what would you do?
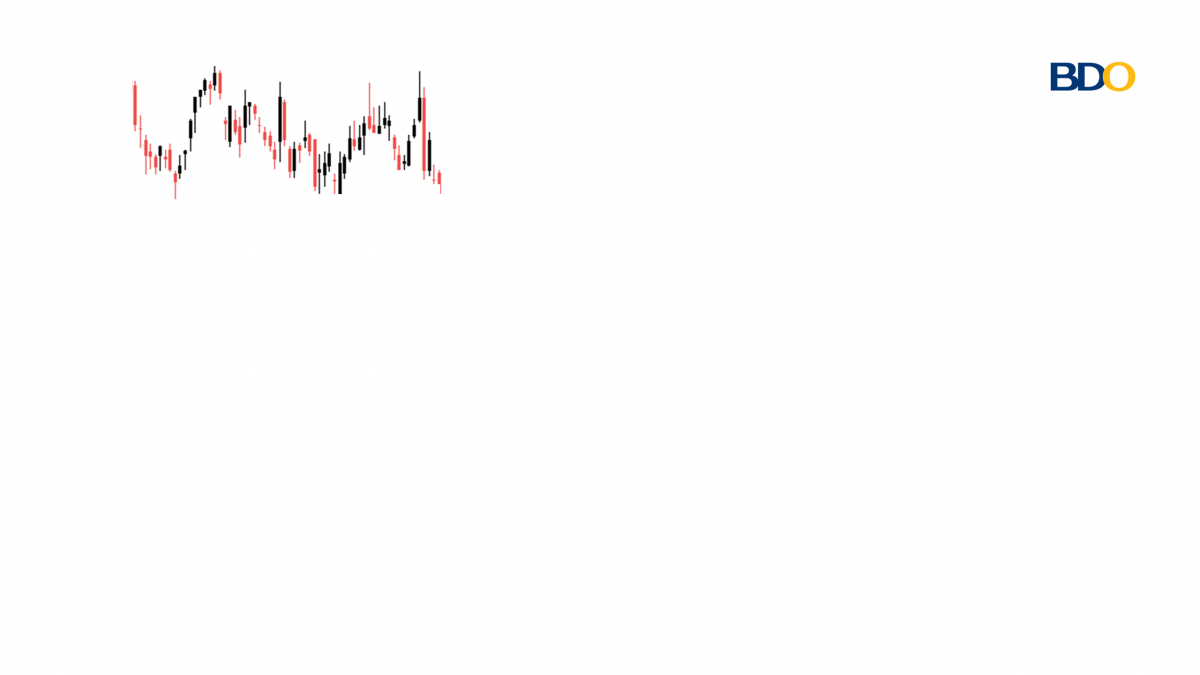
One way to approach this is to first draw your support and resistance lines.
What should you do if the stock price breaks the support line?
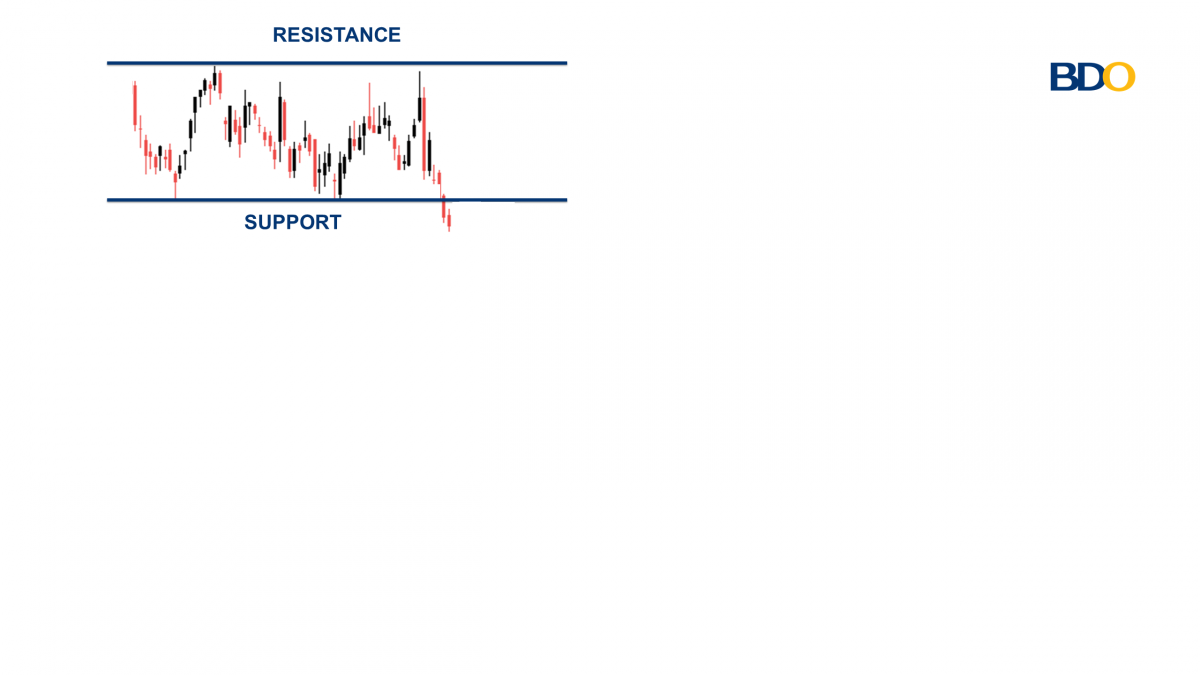
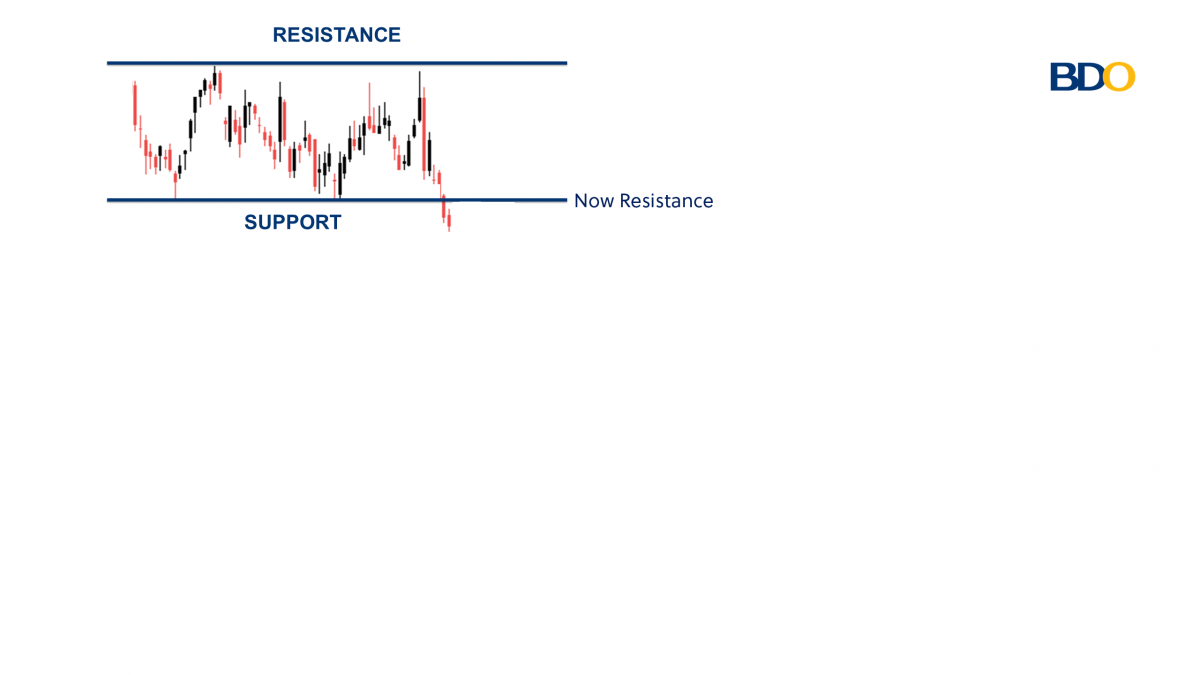
First, since the stock broke the support line you can sell at your predetermined stop loss. You can then change your support line to your resistance line.
_______________________________________________________________________________________________
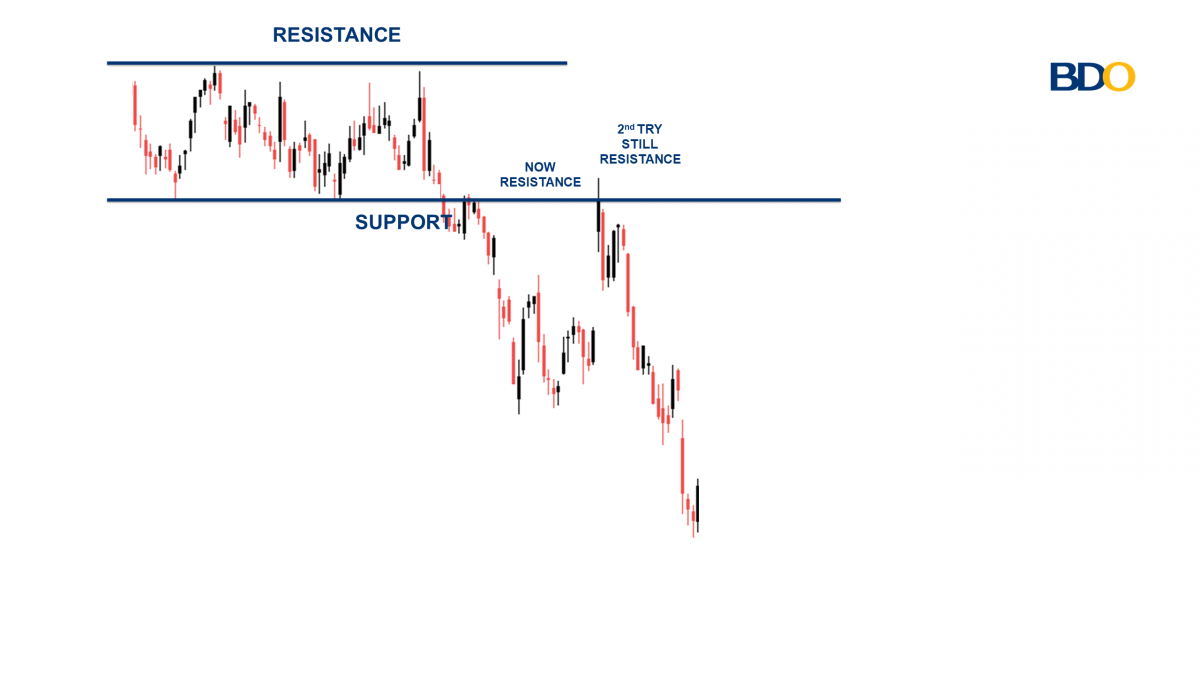
After waiting for a new breakout of resistance, what would you do in this situation?
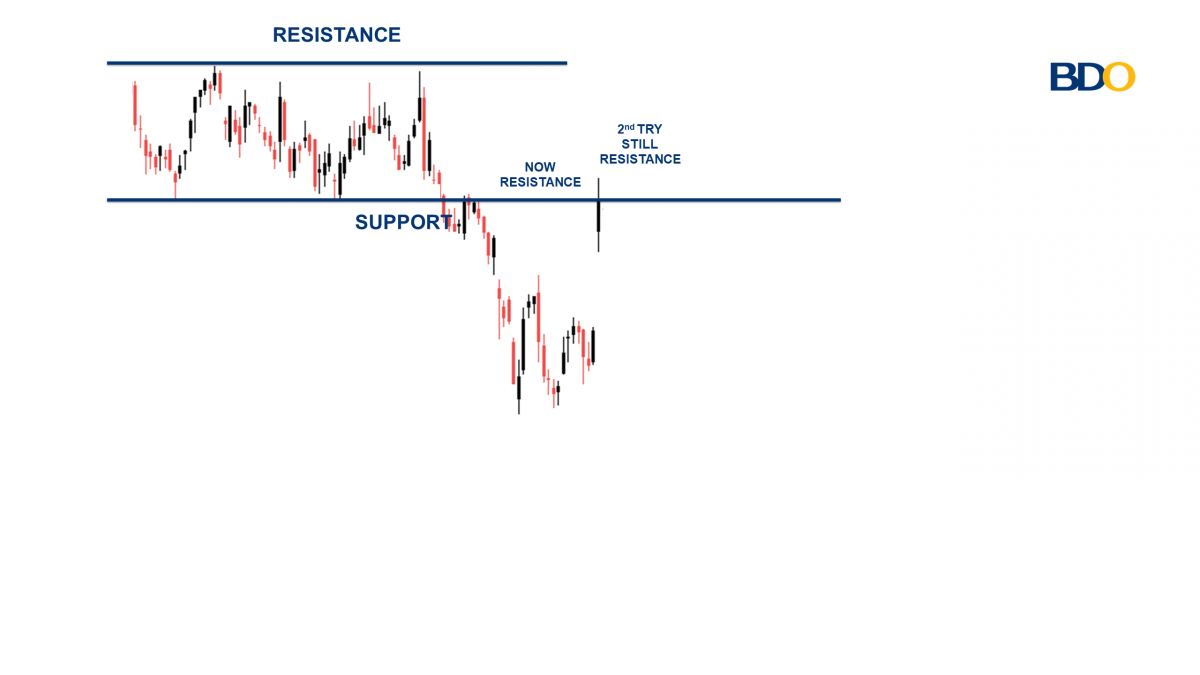
While it may look like the stock broke resistance, it didn’t close above resistance (the price traded above it during the trading day only) and wasn’t considered to be a true breakout. Be careful of false breakouts like this; below you can see this actually resulted in the “kiss of death” and the stock plunged lower.
Trends are a key component when it comes to technical analysis. Using trends can help traders determine support levels, resistance levels, and channels. Fibonacci Retracement is also a helpful tool to use and can help determine price targets for entry and exit points. Using all of these tools in combination with the categories of trends and the direction of trends can help you become a better trader.
We highly suggest watching our video regarding risk management here: Risk Management Video